There are two types of analysis we will follow to find the outliers- Uni-variate(one variable outlier analysis) and Multi-variate(two or more variable outlier analysis).
Discover outliers with visualization tools
if there is an outlier it will plotted as point in boxplot but other population will be grouped together and display as boxes.

Above plot shows three points between 10 to 12, these are outliers as there are not included in the box of other observation i.e nowhere near the quartiles.
Here we analyzed Uni-variate outlier i.e. we used DIS column only to check the outlier.
multivariate outlier analysis
The scatter plot is the collection of points that show values for two variables.
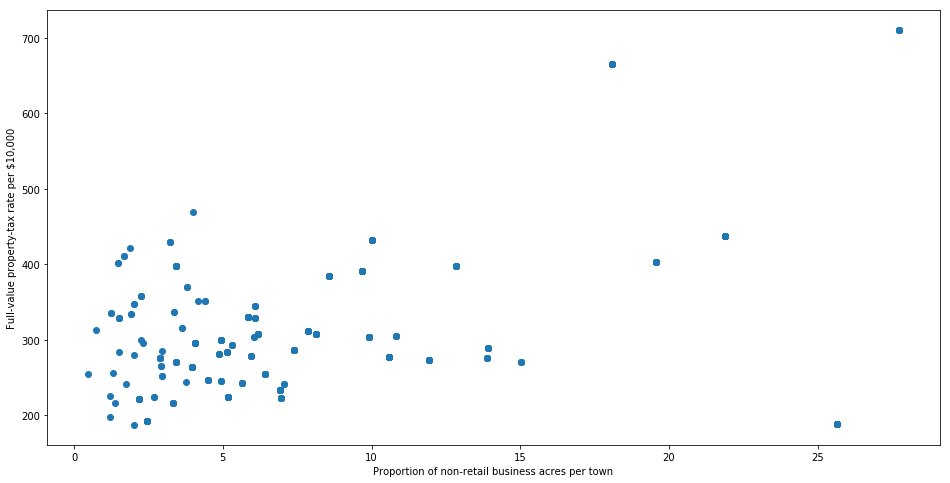
Looking at the plot above, we can most of data points are lying bottom left side but there are points which are far from the population like the top right corner.
Discover outliers with a mathematical function
The intuition behind Z-score is to describe any data point by finding their relationship with the Standard Deviation and Mean of the group of data points. Z-score is finding the distribution of data where mean is 0 and the standard deviation is 1 i.e. normal distribution.
While calculating the Z-score we re-scale and center the data and look for data points which are too far from zero. These data points which are way too far from zero will be treated as the outliers. In most of the cases a threshold of 3 or -3 is used i.e if the Z-score value is greater than or less than 3 or -3 respectively, that data point will be identified as outliers.
We will use Z-score function defined in scipy library to detect the outliers.
from scipy import stats
import numpy as np
z = np.abs(stats.zscore(boston_df))
print(z)
threshold = 3
print(np.where(z > 3))
Box plot uses the IQR method to display data and outliers(shape of the data) but in order to get a list of the identified outlier, we will need to use the mathematical formula and retrieve the outlier data.
IQR is somewhat similar to Z-score in terms of finding the distribution of data and then keeping some threshold to identify the outlier.
Q1 = boston_df_o1.quantile(0.25)
Q3 = boston_df_o1.quantile(0.75)
IQR = Q3 - Q1
print(IQR)
As we now have the IQR scores, it’s time to get hold on outliers. The below code will give an output with some true and false values. The data point where we have False that means these values are valid whereas True indicates presence of an outlier.
print(boston_df_o1 < (Q1 - 1.5 * IQR)) |(boston_df_o1 > (Q3 + 1.5 * IQR))
