Median
The median is the middle score for a set of data that has been arranged in order of magnitude. The median is less affected by outliers and skewed data. In order to calculate the median, suppose we have the data below:
| 65 |
55 |
89 |
56 |
35 |
14 |
56 |
55 |
87 |
45 |
92 |
We first need to rearrange that data into order of magnitude (smallest first):
| 14 |
35 |
45 |
55 |
55 |
56 |
56 |
65 |
87 |
89 |
92 |
Our median mark is the middle mark - in this case, 56 (highlighted in bold). It is the middle mark because there are 5 scores before it and 5 scores after it. This works fine when you have an odd number of scores, but what happens when you have an even number of scores? What if you had only 10 scores? Well, you simply have to take the middle two scores and average the result. So, if we look at the example below:
| 65 |
55 |
89 |
56 |
35 |
14 |
56 |
55 |
87 |
45 |
We again rearrange that data into order of magnitude (smallest first):
| 14 |
35 |
45 |
55 |
55 |
56 |
56 |
65 |
87 |
89
|
Only now we have to take the 5th and 6th score in our data set and average them to get a median of 55.5.
Mode:
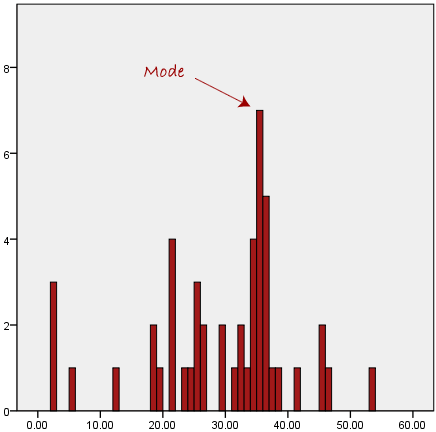
The mode is the most frequent score in our data set. On a histogram it represents the highest bar in a bar chart or histogram. You can, therefore, sometimes consider the mode as being the most popular option. An example of a mode is presented below:
Normally, the mode is used for categorical data where we wish to know which is the most common category, as illustrated below:
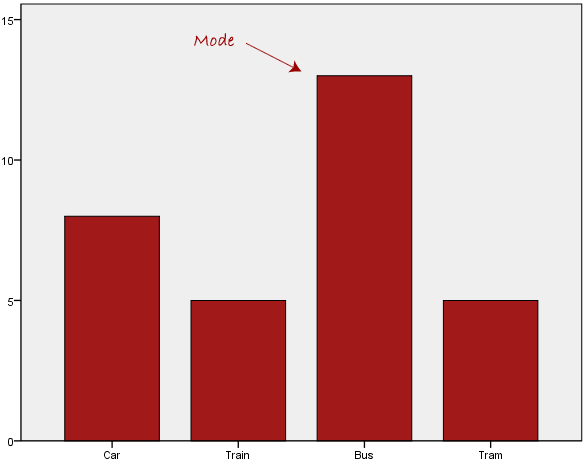
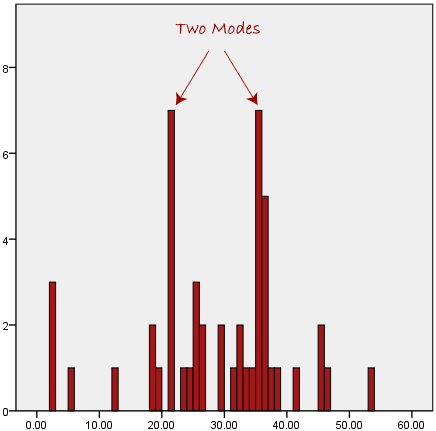
We can see above that the most common form of transport, in this particular data set, is the bus. However, one of the problems with the mode is that it is not unique, so it leaves us with problems when we have two or more values that share the highest frequency, such as below: